Introduction
Financial markets are inherently uncertain, and every trading portfolio carries some degree of market risk. Interest rates change, equity prices fluctuate, foreign exchange rates move continuously, credit spreads widen and narrow, and commodity prices respond to changing supply and demand conditions. While financial institutions devote significant resources to measuring these market movements, they also recognize that how risk is distributed throughout a portfolio can be just as important as the total amount of risk itself.
A trading portfolio may appear to have an acceptable level of market risk when viewed using aggregate metrics such as Value at Risk (VaR), stress testing, or sensitivity analysis. However, if that risk is heavily concentrated in a single issuer, industry, country, maturity bucket, currency, trading desk, or market factor, the portfolio may be substantially more vulnerable than aggregate statistics alone suggest. Concentrated exposures can amplify losses during periods of market stress because adverse events rarely affect isolated positions in isolation. Instead, highly concentrated portfolios often experience multiple positions moving against them simultaneously, reducing diversification benefits that would normally help mitigate losses.
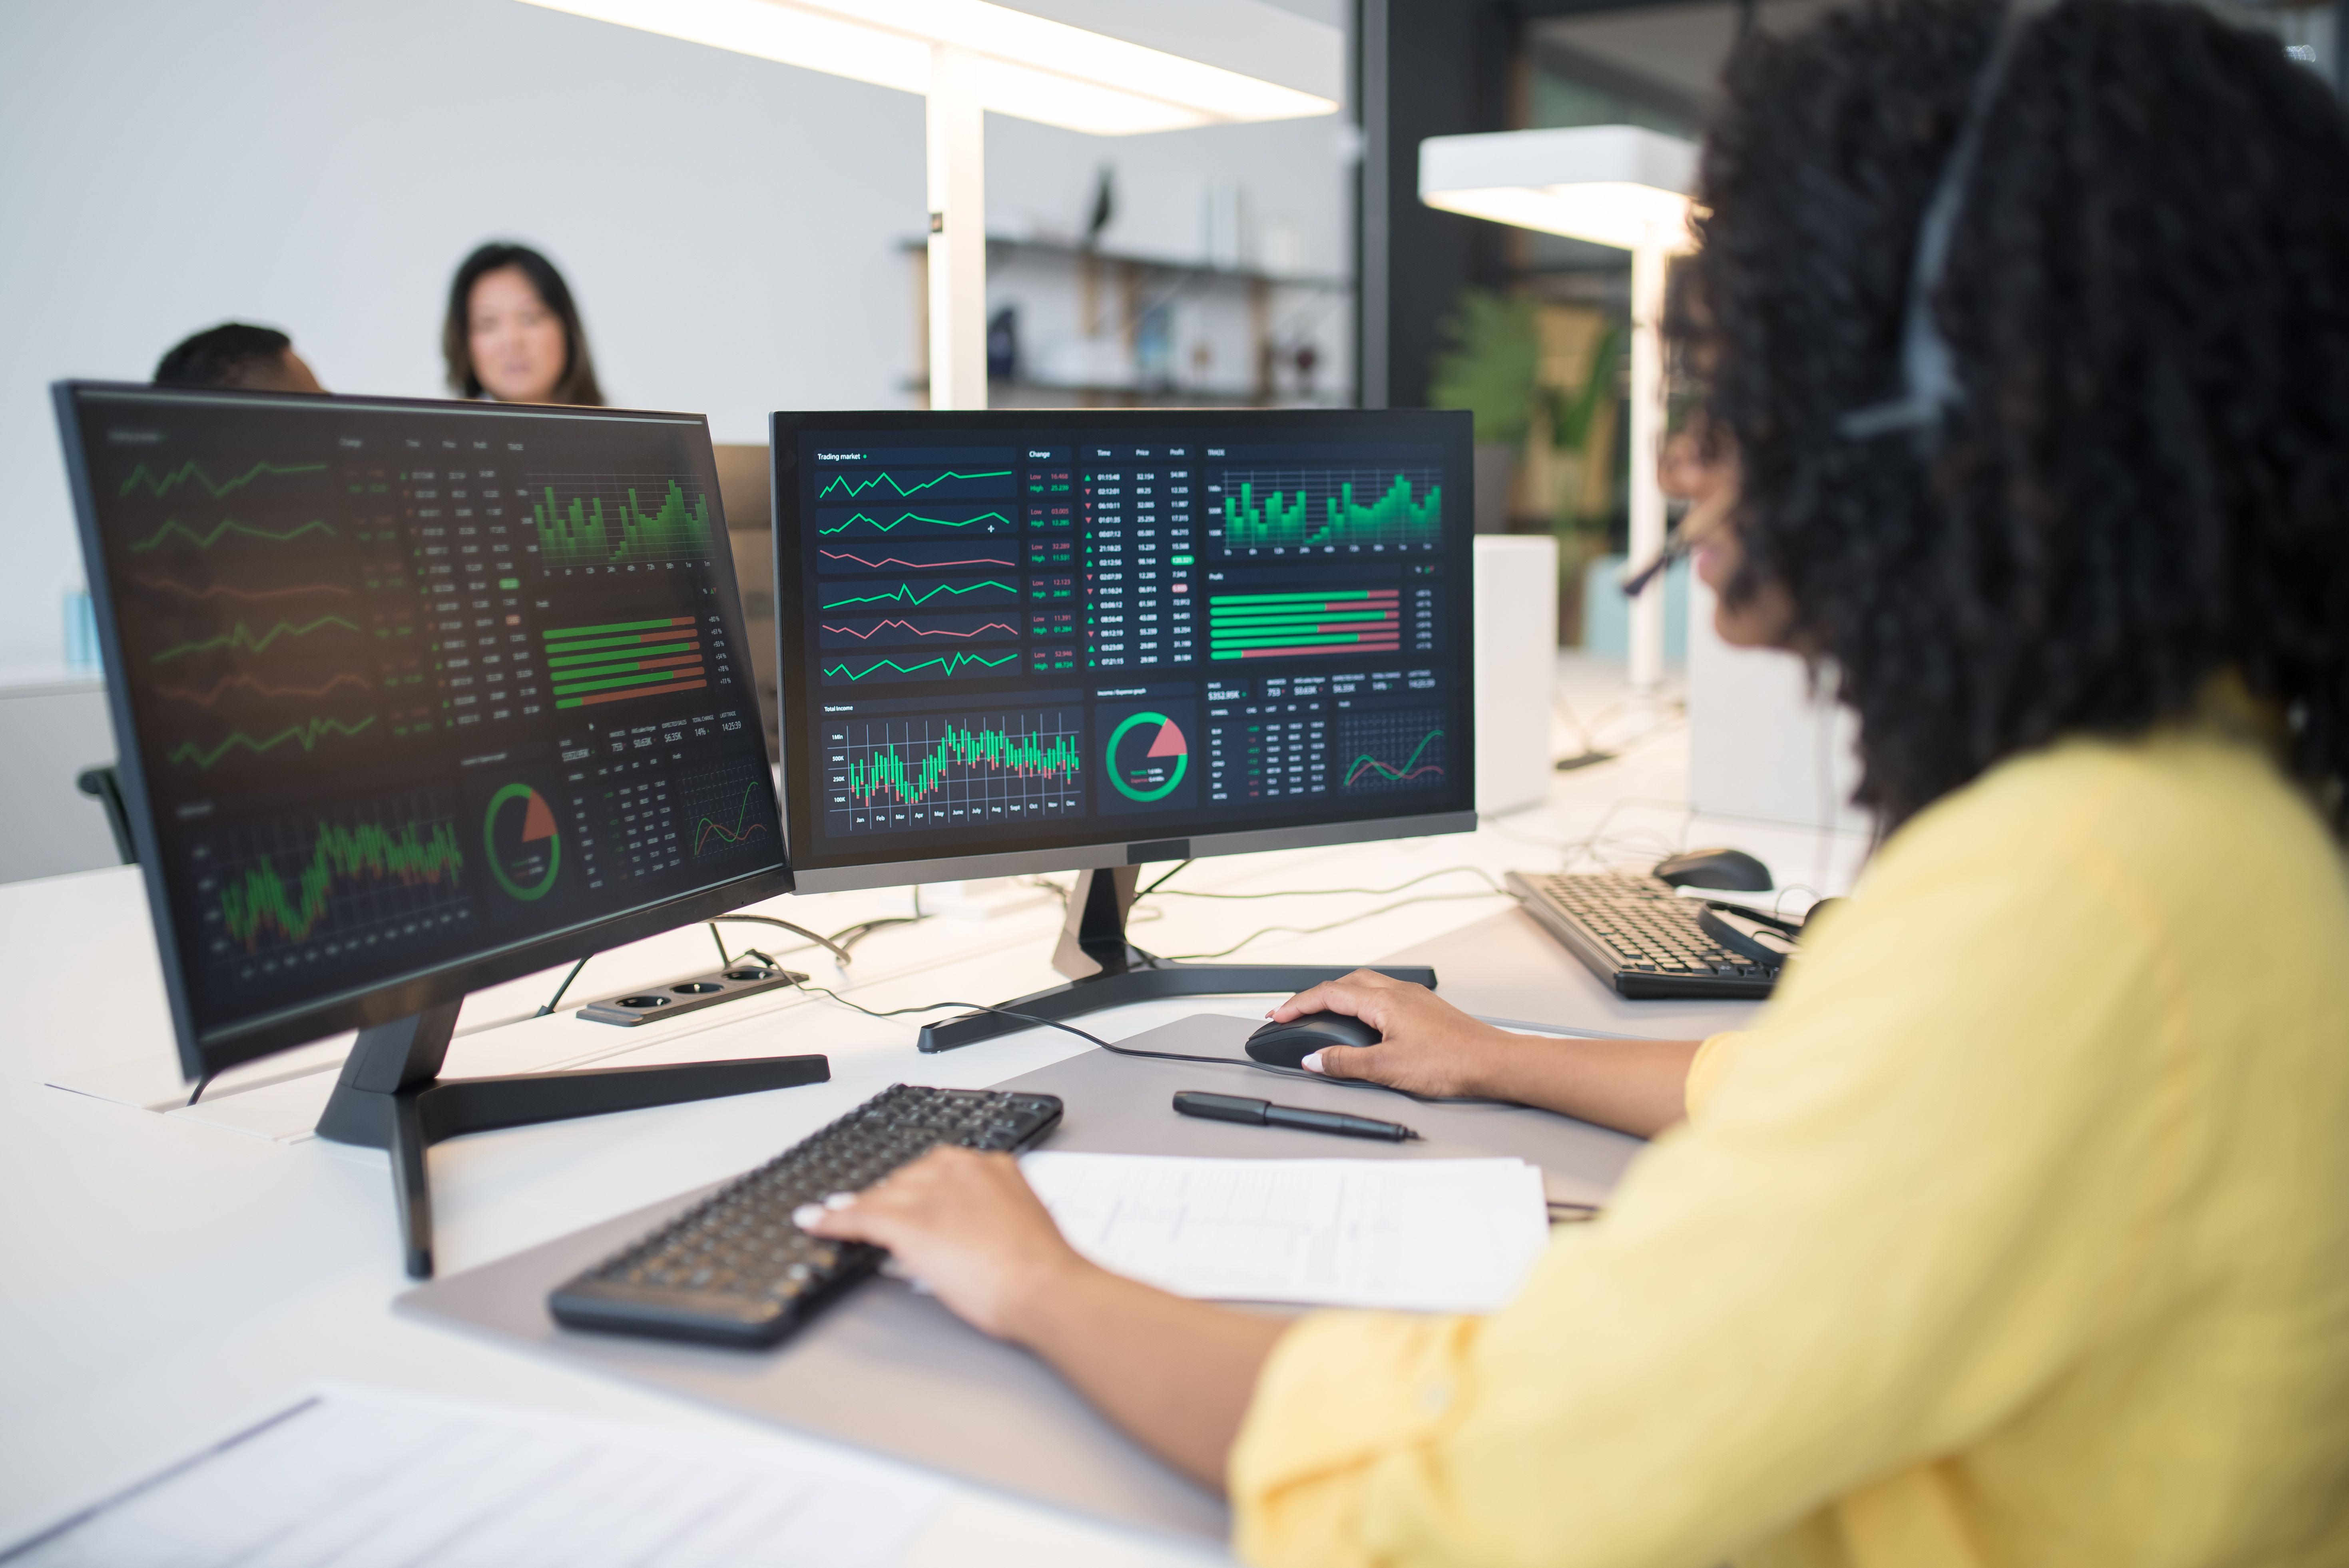
To monitor these vulnerabilities, financial institutions rely on concentration market risk dashboards. These dashboards are specialized reporting tools designed to identify where risk is accumulating across the trading portfolio. Rather than measuring only the overall level of market exposure, they help traders, independent market risk teams, senior management, and governance committees understand whether the institution has become overly dependent on particular markets, products, counterparties, issuers, or economic themes.
Concentration dashboards have become increasingly important since the Global Financial Crisis demonstrated that institutions could experience significant losses despite appearing well diversified based on traditional risk measures. Regulatory expectations have also evolved, placing greater emphasis on identifying concentrations before they develop into material sources of financial loss. Today, concentration reporting is considered a core component of market risk governance, complementing sensitivity reports, Value at Risk calculations, stress testing, and scenario analysis.
Understanding how concentration dashboards are designed and used provides valuable insight into one of the most important tools supporting modern market risk oversight.
Why Concentration Market Risk Dashboards Matter
When discussing market risk, many people naturally focus on the total amount of exposure a portfolio carries. Questions such as “How much Value at Risk does the desk have?” or “What is the portfolio’s total duration?” are common starting points for evaluating risk. While these measures remain essential, they do not fully explain whether the underlying exposures are appropriately diversified.
Consider two trading portfolios with identical Value at Risk calculations. At first glance, both portfolios may appear equally risky. However, the first portfolio may contain positions across dozens of industries, currencies, countries, and issuers, while the second portfolio could be heavily invested in a single sector, one geographic region, or one type of financial instrument. If an adverse event specifically affects that concentrated area, the second portfolio may experience significantly larger losses than the first despite having identical aggregate risk measures.
This illustrates the fundamental concept behind concentration risk. Risk is not determined solely by its size but also by its distribution.
Financial history provides numerous examples where concentration risk became a major contributor to institutional losses. During the Global Financial Crisis, many institutions believed they maintained diversified mortgage-related portfolios. Subsequent events demonstrated that exposures across different products, issuers, and structures were often linked to the same underlying housing market risks. What appeared diversified under normal market conditions became highly concentrated once housing prices declined simultaneously across large portions of the market.
Similar concentration issues have appeared during sovereign debt crises, commodity price collapses, emerging market disruptions, technology sector downturns, and periods of elevated interest rate volatility. In each case, portfolios that appeared adequately diversified using traditional metrics experienced unexpectedly large losses because underlying exposures shared common risk drivers that became highly correlated during periods of market stress.
Concentration risk therefore challenges one of the most important assumptions in portfolio management: that diversification will reduce overall risk. Diversification remains effective only when exposures genuinely respond differently to changing market conditions. When numerous positions depend upon the same economic factors, diversification benefits may disappear precisely when they are needed most.
This explains why concentration analysis has become an essential complement to traditional market risk measurement. Rather than replacing metrics such as Value at Risk or sensitivity analysis, concentration reporting helps institutions understand whether those risks are distributed broadly across the portfolio or accumulating within a relatively small number of common exposures.
For independent market risk teams, identifying concentrations early provides opportunities to discuss portfolio adjustments before market events expose those vulnerabilities. For senior management, concentration reporting strengthens governance by highlighting risks that may not be immediately apparent through aggregate portfolio statistics alone.
What Are Concentration Market Risk Dashboards?
A concentration market risk dashboard is a management reporting tool that summarizes where market risk is accumulating across a trading portfolio. Instead of asking how much total risk exists, the dashboard focuses on where that risk is located and whether exposures have become overly concentrated in areas that could increase potential losses under adverse market conditions.
Unlike traditional market risk reports that emphasize aggregate metrics such as Value at Risk, stress test results, or daily profit and loss, concentration dashboards break portfolios into meaningful categories that allow management to evaluate diversification more effectively. These reports help answer questions such as:
- Are too many positions concentrated within a single issuer?
- Has interest rate exposure become concentrated in one section of the yield curve?
- Is foreign exchange risk heavily dependent on one currency pair?
- Are multiple trading desks exposed to the same macroeconomic event?
- Has exposure to one industry grown significantly over recent months?
By organizing information in this way, concentration dashboards provide a more detailed understanding of portfolio construction than aggregate risk metrics alone can provide.
Most dashboards rely heavily on visual reporting techniques. Heat maps, treemaps, concentration charts, geographic maps, ranking tables, trend graphs, and exposure distributions allow users to identify areas of concern quickly. Rather than reviewing thousands of individual positions, executives can immediately recognize whether particular sectors, issuers, countries, or products represent unusually large portions of the institution’s overall market risk.
Many concentration dashboards also include historical trend analysis. Comparing reports across multiple months or quarters allows risk managers to determine whether concentrations are increasing gradually or whether recent trading activity has materially altered the portfolio’s composition. These trends often provide valuable early warning signals that would be difficult to identify through daily exposure reports alone.
Importantly, concentration dashboards are rarely intended to recommend investment decisions. Their purpose is to support oversight and governance. A concentrated position may be entirely appropriate if it reflects an approved trading strategy, client facilitation activity, or temporary market opportunity. The dashboard simply ensures that decision-makers remain aware of these exposures while evaluating whether they remain consistent with the institution’s risk appetite.
As portfolios continue growing in size and complexity, concentration dashboards have become one of the most effective methods for transforming large volumes of trading data into meaningful information that supports informed market risk management.
The Different Types of Concentration Risk Monitored by Banks
Concentration risk extends far beyond holding a large position in a single security. Modern financial institutions monitor numerous forms of concentration because market risk can accumulate across many different dimensions simultaneously. Effective concentration dashboards therefore examine portfolios from multiple perspectives rather than relying on a single measurement.
One of the most familiar forms is issuer concentration. Large exposures to an individual corporate issuer or sovereign government may create significant vulnerabilities if that issuer experiences financial distress or credit deterioration. Independent market risk teams therefore monitor how much of the portfolio depends upon the financial health of any single borrower or security issuer.
Sector concentration represents another important area of focus. Even when individual issuer exposures remain relatively small, significant investments within one industry—such as technology, financial services, healthcare, or energy—may expose portfolios to industry-specific economic developments. Dashboards often summarize exposures across standardized industry classifications to identify whether risk has become heavily concentrated within particular sectors.
Geographic concentration also receives considerable attention. Global financial institutions frequently operate across dozens of countries, yet political developments, regulatory changes, natural disasters, or regional economic downturns may affect entire geographic markets simultaneously. Concentration dashboards therefore organize exposures by country, region, or economic bloc to support enterprise-wide monitoring.
Within fixed income businesses, maturity concentration plays a particularly important role. A portfolio heavily concentrated in long-duration securities may respond very differently to interest rate changes than one distributed evenly across multiple maturity ranges. Dashboards frequently display exposure across different sections of the yield curve, helping traders and market risk managers identify where duration risk has accumulated.
Currency concentration becomes increasingly important within foreign exchange trading and internationally diversified portfolios. Institutions monitor whether significant portions of market risk depend upon movements in individual currencies or currency pairs, particularly during periods of elevated geopolitical uncertainty or monetary policy divergence.
Some institutions also monitor concentration by trading desk, product type, asset class, legal entity, client activity, or underlying macroeconomic risk factor. For example, several apparently unrelated trading desks may all carry substantial exposure to declining interest rates or increasing energy prices. While individual reports may not identify these relationships, enterprise-wide concentration dashboards reveal common risk drivers across the organization.
This multidimensional approach explains why concentration dashboards have become indispensable within modern market risk management. By examining exposures through multiple lenses simultaneously, financial institutions gain a much deeper understanding of portfolio vulnerabilities than would be possible through aggregate market risk metrics alone.
How Trading Desks Use Concentration Dashboards
For most trading desks, concentration risk is managed continuously rather than only during formal governance reviews. While independent market risk functions provide oversight, the first line of defense remains responsible for understanding how trading activity changes the overall composition of the portfolio. Concentration dashboards therefore serve as practical decision-making tools that traders consult throughout the trading day to evaluate how individual transactions affect the broader distribution of market risk.
Unlike profit and loss reports, which primarily summarize financial performance after market movements have occurred, concentration dashboards focus on the structure of the portfolio itself. Every trade changes that structure in some way. Purchasing additional government bonds may increase exposure to a particular sovereign issuer. Executing several corporate bond trades within the same industry may gradually increase sector concentration. Adding equity derivatives tied to large technology companies could create greater exposure to one portion of the equity market, even if each individual trade appears relatively small.
Because these changes accumulate over time, traders use concentration dashboards to monitor how new positions affect overall portfolio diversification. Before executing larger transactions, portfolio managers often review current exposures to determine whether the proposed trade would materially increase an existing concentration. In many cases, traders may choose an alternative security or instrument that provides similar economic exposure while improving portfolio diversification.
Concentration dashboards also assist traders when rebalancing portfolios. As markets move, the relative size of existing positions changes naturally. A strong rally in one sector, for example, may cause that sector to represent a much larger percentage of total portfolio exposure than originally intended. Without executing a single trade, concentration levels can increase simply because certain assets outperform others. Dashboards help identify these shifts early, allowing traders to rebalance exposures before concentrations become excessive.
Another common use involves managing inventory accumulated through client facilitation. Many investment banks act as market makers, purchasing securities from clients while searching for subsequent buyers. During periods of reduced market liquidity, trading desks may temporarily accumulate significant inventories within particular issuers, sectors, or asset classes. Concentration dashboards allow traders to monitor these temporary exposures while developing strategies to reduce inventory over time without disrupting client activity.
Trading desks also rely on concentration reporting during periods of heightened market volatility. Unexpected macroeconomic announcements, central bank decisions, geopolitical developments, or significant corporate events can rapidly alter portfolio composition. A concentrated position that appeared manageable under normal market conditions may require closer monitoring if market liquidity deteriorates or correlations between assets begin increasing.
Importantly, concentration dashboards do not prevent traders from taking meaningful positions. Many successful investment strategies require conviction and may intentionally involve concentrated exposures based on specific market views. The dashboard simply ensures those exposures remain visible, measurable, and consistent with the firm’s approved risk appetite. Rather than discouraging risk-taking, concentration reporting promotes informed risk-taking by providing traders with a clear understanding of how individual positions contribute to the overall portfolio structure.
By integrating concentration analysis into daily trading decisions, financial institutions strengthen the first line of defense while reducing the likelihood that unintended exposures develop gradually without management awareness.
How Independent Market Risk Uses Concentration Dashboards
While trading desks use concentration dashboards primarily to support portfolio management decisions, independent market risk teams interpret the same information through the lens of governance, oversight, and enterprise-wide risk management. Their objective is not to determine whether a particular investment strategy is profitable but rather to evaluate whether concentrations remain consistent with the institution’s approved risk appetite and whether emerging exposures warrant additional scrutiny.
Each reporting cycle, market risk professionals review concentration dashboards across multiple business lines, trading desks, legal entities, and asset classes. Instead of examining individual securities alone, they assess whether broader patterns are beginning to emerge. For example, several fixed income desks may independently increase exposure to longer-duration assets in response to declining interest rates. Viewed individually, each portfolio may appear reasonable. However, when aggregated across the institution, the combined concentration may become materially larger than intended.
This enterprise-wide perspective represents one of the greatest strengths of independent market risk oversight. Trading desks naturally focus on their own portfolios, whereas market risk teams evaluate how exposures accumulate across the organization as a whole. Concentration dashboards facilitate this broader view by consolidating information that would otherwise remain fragmented across multiple businesses.
One important responsibility involves identifying concentrations that cross traditional organizational boundaries. A financial institution may simultaneously hold corporate bonds issued by an energy company, equity options linked to energy producers, commodity derivatives tied to crude oil prices, and loans supporting energy infrastructure projects. While these exposures originate from different businesses, they may all depend upon the same underlying economic factors. Concentration dashboards help reveal these interconnected relationships, allowing independent market risk to evaluate aggregate exposure rather than isolated positions.
Market risk teams also monitor concentration trends over time. A gradually increasing exposure often receives as much attention as an already elevated concentration because trends may indicate that portfolio composition is changing in ways not immediately visible through daily reporting. By reviewing monthly and quarterly dashboard comparisons, risk managers can identify developing patterns before they exceed formal governance thresholds.
When significant concentrations are identified, independent market risk engages directly with business leadership. These discussions seek to understand the rationale supporting the exposure, expected holding periods, planned mitigation strategies, and potential downside scenarios. Many concentrations are entirely appropriate, particularly when driven by approved client activity or deliberate strategic positioning. Nevertheless, governance requires that these exposures be clearly understood, documented, and actively monitored.
Concentration dashboards also support formal limit monitoring. Some institutions establish quantitative thresholds governing issuer concentrations, sector exposures, geographic allocations, maturity distributions, or macroeconomic risk factors. When dashboards indicate that these thresholds have been exceeded, market risk teams initiate escalation procedures consistent with the institution’s governance framework. Depending on the significance of the concentration, notifications may extend from desk management to Chief Risk Officers, executive committees, or board-level risk oversight forums.
Through continuous monitoring, independent challenge, and structured governance, concentration dashboards enable market risk teams to identify vulnerabilities that might otherwise remain hidden until adverse market conditions expose them.
Concentration Dashboards Across Different Asset Classes
Although the underlying objective of concentration reporting remains consistent across financial markets, the specific exposures monitored vary considerably depending on the asset class involved. Different markets respond to different economic drivers, requiring dashboards to present information tailored to the unique characteristics of each trading business while maintaining a consistent enterprise-wide approach to risk monitoring.
Within fixed income trading, concentration dashboards often emphasize issuer exposure, duration distribution, yield curve positioning, credit ratings, industry sectors, and geographic allocations. A government bond portfolio, for example, may appear diversified based on the number of securities held but still exhibit significant concentration if most positions are located within the long end of the yield curve or concentrated among sovereign issuers with highly correlated economic risks. Dashboards therefore organize exposures across maturity buckets, credit quality, issuer types, and regions to provide a more complete understanding of portfolio diversification.
In equity markets, dashboards frequently focus on individual stock exposures, sector concentrations, market capitalization, geographic regions, and index memberships. A portfolio invested across hundreds of securities may still exhibit significant concentration if a large percentage of total exposure depends on technology companies or a handful of mega-cap stocks. Concentration dashboards help identify these relationships by presenting both security-level and sector-level views of portfolio composition.
Foreign exchange trading introduces another dimension because currencies often respond simultaneously to interest rate expectations, geopolitical developments, and macroeconomic conditions. Dashboards may summarize exposures by individual currency, currency pair, geographic region, or economic bloc while also highlighting positions that depend upon common monetary policy themes. This broader perspective becomes particularly valuable during periods of heightened central bank activity or global economic uncertainty.
Within commodity markets, concentration reporting often focuses on product categories, delivery locations, seasonal exposures, and supply chain dependencies. Energy portfolios may distinguish between crude oil, refined products, natural gas, and electricity markets, while agricultural businesses monitor exposures across crops, growing regions, and harvest cycles. Because commodity markets frequently experience localized supply disruptions, geographic concentration receives particular attention within these businesses.
Credit trading presents unique concentration challenges because exposures often depend simultaneously on issuer quality, industry sector, maturity profile, and macroeconomic conditions. Dashboards commonly summarize concentrations across credit ratings, economic sectors, geographic regions, and spread duration while identifying portfolios heavily dependent upon particular industries or credit market conditions.
At the enterprise level, institutions increasingly consolidate information across all asset classes into integrated concentration dashboards. These reports reveal broader patterns that individual business reports cannot identify. Multiple trading desks may each appear appropriately diversified within their own markets while collectively accumulating significant exposure to common economic themes such as declining interest rates, rising inflation, increasing energy prices, or deteriorating emerging market conditions.
This integrated approach enables senior management to understand not only how concentration risk develops within individual businesses but also how it evolves across the institution as a whole. As financial products become increasingly interconnected, enterprise-wide concentration reporting has become an essential component of effective market risk governance.
Dashboard Design and Key Metrics
The effectiveness of a concentration market risk dashboard depends not only on the quality of the underlying data but also on how that information is presented to decision-makers. Large financial institutions manage portfolios containing tens of thousands of individual positions across multiple trading desks, legal entities, asset classes, and geographic regions. Without thoughtful dashboard design, the sheer volume of information can make it difficult for traders, market risk professionals, and senior executives to identify the exposures that matter most.
A well-designed concentration dashboard is built around one central objective: allowing users to recognize significant concentrations quickly without losing access to the supporting detail needed for further investigation. Rather than presenting lengthy spreadsheets containing every individual position, dashboards summarize exposures using visualizations that immediately highlight areas requiring additional attention.
Many concentration dashboards begin with a high-level executive summary that presents the institution’s largest concentrations across several dimensions. This may include the ten largest issuer exposures, the largest industry allocations, geographic concentrations, currency distributions, maturity concentrations, or the most significant macroeconomic risk themes. By presenting this information prominently, decision-makers can understand the portfolio’s overall concentration profile within minutes.
Drill-down functionality is another defining characteristic of modern dashboards. Users often begin by reviewing enterprise-wide exposures before navigating to specific legal entities, business lines, trading desks, portfolios, or individual positions. This layered approach allows executives to maintain a strategic perspective while enabling traders and risk managers to investigate the detailed drivers underlying significant concentrations.
Heat maps remain one of the most frequently used visualization techniques because they quickly communicate where concentrations are increasing. Color gradients help users distinguish between normal exposures and areas approaching internal risk limits. Treemaps provide another valuable perspective by displaying the relative size of different portfolio segments, making unusually large concentrations immediately visible even when numerous categories are represented simultaneously.
Trend charts are equally important because concentrations rarely emerge overnight. By comparing current exposures with previous reporting periods, dashboards illustrate whether particular concentrations are growing, declining, or remaining stable. These historical views often provide more valuable insight than isolated point-in-time measurements because they reveal gradual changes that may eventually require management action.
Many institutions also incorporate utilization indicators showing how current concentrations compare with approved internal limits. Rather than displaying exposure amounts alone, dashboards often express concentrations as percentages of established thresholds. This allows both traders and independent market risk teams to understand not only where concentrations exist but also how close they are to governance boundaries requiring escalation or remediation.
Another common feature involves ranking exposures by materiality. Rather than attempting to monitor every portfolio component equally, dashboards prioritize the largest contributors to concentration risk. This enables management to focus discussions on the relatively small number of exposures most likely to influence the institution’s overall market risk profile.
Ultimately, effective dashboard design transforms complex portfolio information into actionable intelligence. By organizing exposures visually, supporting detailed investigation, and emphasizing trends over isolated measurements, concentration dashboards allow institutions to monitor increasingly complex trading activities while maintaining efficient governance and informed decision-making.
Common Challenges and Limitations
Although concentration dashboards provide valuable insight into portfolio composition, they are not without limitations. Like every market risk reporting tool, their usefulness depends upon accurate data, appropriate interpretation, and an understanding of what the dashboard is—and is not—designed to measure. Financial institutions therefore recognize that concentration reporting should complement, rather than replace, other forms of market risk analysis.
One of the most significant challenges involves defining what constitutes a concentration. At first glance, the answer appears straightforward. Large exposures to a single issuer or sector clearly represent concentrations. In practice, however, concentration risk is often much more nuanced. Two apparently unrelated positions may depend upon the same macroeconomic drivers, while several smaller exposures spread across different products may collectively represent substantial concentration to one underlying market theme.
For example, a bank may hold government bonds, interest rate swaps, mortgage-backed securities, and utility stocks. Individually, these appear diversified because they belong to different asset classes. Yet each may be heavily influenced by changes in long-term interest rates. A dashboard focused only on asset class allocations might fail to recognize this shared dependency, whereas one organized around underlying risk factors would identify a significant concentration.
Another challenge involves changing market relationships. Correlations between financial assets are rarely constant. During periods of normal market conditions, sectors, regions, or asset classes may behave independently, supporting diversification. However, during financial crises, geopolitical events, or systemic shocks, assets that historically moved independently often become highly correlated. Concentration dashboards based on historical relationships may therefore underestimate emerging risks during periods of market stress.
Portfolio complexity creates additional difficulties. Large institutions frequently manage positions across multiple legal entities, currencies, valuation systems, and booking platforms. Consolidating this information consistently requires extensive data governance and standardized reporting methodologies. Differences in position classification, pricing conventions, or market data sources can materially affect reported concentrations if not managed carefully.
Threshold selection presents another practical consideration. Setting concentration limits too conservatively may generate excessive alerts that provide little management value, leading users to overlook genuinely important issues. Conversely, thresholds that are too generous may fail to identify meaningful concentrations until exposures have already become significant. Institutions therefore review concentration limits regularly to ensure they remain aligned with changing market conditions, portfolio strategies, and organizational risk appetite.
Interpretation also requires professional judgment. A large concentration is not automatically a governance concern. Many investment strategies intentionally involve concentrated positions supported by extensive research and clearly defined risk management plans. Likewise, temporary concentrations resulting from client facilitation activities may be entirely appropriate within the context of the institution’s business model. Dashboards identify exposures, but they cannot determine whether those exposures are justified or whether mitigation actions are necessary.
These limitations reinforce an important principle of market risk management: concentration dashboards provide valuable decision support, but effective governance depends upon combining analytical tools with experienced human judgment, independent challenge, and ongoing communication across the organization.
Technology Behind Concentration Risk Reporting
The scale and complexity of modern financial markets make concentration reporting impossible without advanced technology. Every trading day, global financial institutions process enormous volumes of transactions across fixed income, equities, foreign exchange, commodities, derivatives, and structured products. Each trade changes the institution’s overall market risk profile, requiring concentration dashboards to update continuously as portfolios evolve.
The reporting process begins with trade capture. As transactions are executed, information flows automatically from front-office trading systems into centralized risk platforms. These systems consolidate positions from numerous business lines while standardizing security identifiers, issuer information, market classifications, currencies, maturity dates, and other characteristics needed for concentration analysis.
Once position data has been collected, specialized risk engines aggregate exposures across multiple dimensions simultaneously. Rather than simply calculating the total market value of individual positions, these systems organize portfolios according to issuer, industry, geography, maturity, currency, product type, legal entity, trading desk, and macroeconomic risk factors. This multidimensional analysis allows dashboards to reveal concentrations that would remain hidden if positions were reviewed individually.
Market data integration is equally important. Concentration calculations often depend upon current market prices, exchange rates, yield curves, volatility surfaces, credit ratings, and benchmark classifications. Automated data feeds ensure dashboards reflect changing market conditions throughout the trading day while reducing manual intervention and improving reporting consistency.
Business intelligence platforms transform this underlying information into interactive dashboards tailored to different users. Traders may receive detailed portfolio-level views showing individual security concentrations, while independent market risk teams review aggregated exposures across multiple desks. Executive dashboards emphasize strategic trends, major concentrations, and limit utilization rather than operational details.
Cloud computing and distributed processing have significantly enhanced reporting capabilities in recent years. Institutions can now process substantially larger datasets while delivering near real-time concentration reporting across globally distributed trading businesses. This increased computing capacity also supports more sophisticated analytics, including historical trend analysis, scenario comparisons, and enterprise-wide exposure aggregation.
Artificial intelligence and machine learning are beginning to influence concentration reporting as well. Rather than replacing traditional risk measurement, these technologies help identify unusual changes in portfolio composition, detect emerging concentration patterns, and prioritize exposures requiring further investigation. Natural language processing may also supplement quantitative analysis by incorporating information from market news, regulatory announcements, and economic publications that could influence future concentration risks.
Despite these technological advances, successful concentration reporting continues to depend upon strong governance. Systems must be supported by accurate market data, validated models, standardized classifications, and clearly defined ownership of reporting processes. Technology enables timely analysis, but experienced market risk professionals remain responsible for interpreting results, challenging business assumptions, and ensuring concentrations are managed within the institution’s approved risk appetite.
Why Concentration Dashboards Are Critical to Modern Market Risk Governance
Over the past two decades, concentration dashboards have evolved from useful reporting tools into fundamental components of enterprise market risk governance. Their growing importance reflects a broader shift in how financial institutions think about market risk. Rather than evaluating exposures solely through aggregate metrics such as Value at Risk or stress testing, organizations increasingly recognize that understanding where risk is concentrated is essential to understanding how that risk may behave during periods of market stress.
One of the greatest strengths of concentration dashboards is their ability to bridge the gap between portfolio management and governance oversight. Traders use concentration information to make day-to-day investment decisions, while independent market risk functions monitor the same exposures through the lens of enterprise risk appetite. Senior management relies on aggregated dashboard reporting to evaluate strategic risk concentrations across business lines, and board risk committees use summarized information to oversee whether the institution’s overall market risk profile remains consistent with its long-term objectives.
Concentration dashboards also improve communication across the three lines of defense. Because exposures are presented using standardized metrics and consistent classifications, discussions between trading desks, market risk, finance, internal audit, and executive leadership become more transparent and objective. Rather than debating isolated positions, governance discussions focus on broader portfolio themes, diversification strategies, emerging concentrations, and mitigation plans.
Another significant benefit is the dashboards’ forward-looking nature. Market losses often occur rapidly, leaving little time for corrective action once adverse events begin unfolding. Concentration reporting provides earlier visibility into portfolio vulnerabilities by identifying where risk is accumulating before market conditions deteriorate. This allows institutions to evaluate potential adjustments gradually rather than reacting under stressed market conditions when liquidity may be limited and transaction costs substantially higher.
Regulatory expectations have further reinforced the importance of concentration reporting. Supervisory authorities increasingly expect financial institutions to demonstrate that they understand not only the amount of market risk they carry but also how that risk is distributed across products, issuers, sectors, and macroeconomic factors. Concentration dashboards help satisfy these expectations by providing documented evidence that institutions actively monitor diversification and maintain governance processes for addressing significant exposures.
Perhaps most importantly, concentration dashboards encourage better strategic decision-making. Investment opportunities frequently arise within specific sectors or markets, creating natural incentives for traders to increase exposure where expected returns appear most attractive. Dashboards do not prevent these strategies, but they ensure decision-makers understand the cumulative effect of individual trading decisions across the broader organization. This transparency allows institutions to balance revenue generation with prudent risk management more effectively.
As financial markets continue becoming increasingly interconnected, concentration dashboards will remain one of the most valuable tools supporting disciplined market risk governance, enterprise oversight, and informed portfolio management.
Conclusion
Concentration market risk dashboards provide financial institutions with a structured approach to understanding how market risk is distributed throughout complex trading portfolios. While traditional market risk measures quantify the overall level of exposure, concentration dashboards reveal where that exposure is accumulating across issuers, sectors, geographic regions, currencies, maturities, products, and broader economic themes.
Throughout the organization, these dashboards support multiple stakeholders. Traders use them to manage portfolio diversification during the trading day, independent market risk teams monitor exposures against approved governance thresholds, senior management evaluates enterprise-wide risk concentrations, and board committees oversee alignment with the institution’s risk appetite. Combined with sensitivity reports, Value at Risk, stress testing, and scenario analysis, concentration dashboards provide an additional layer of insight that helps institutions identify vulnerabilities before adverse market conditions expose them.
As portfolios become more sophisticated and global markets increasingly interconnected, understanding concentration risk has become just as important as measuring market risk itself. By transforming large volumes of portfolio data into meaningful, actionable reporting, concentration dashboards remain an essential component of modern market risk management and governance.
This article is provided for informational and educational purposes only. It offers a high-level overview of sensitivity reports (Greeks) and their role within market risk management. It should not be interpreted as investment, trading, financial, legal, regulatory, accounting, tax, or professional advice. Risk measurement methodologies, pricing models, governance frameworks, and reporting practices vary across financial institutions and jurisdictions and may evolve over time.
Stay Ahead
Access informational and educational resources. Subscribe to the Vault Newsletter for curated materials, learning frameworks, developmental tools, and early previews of upcoming releases.