Introduction
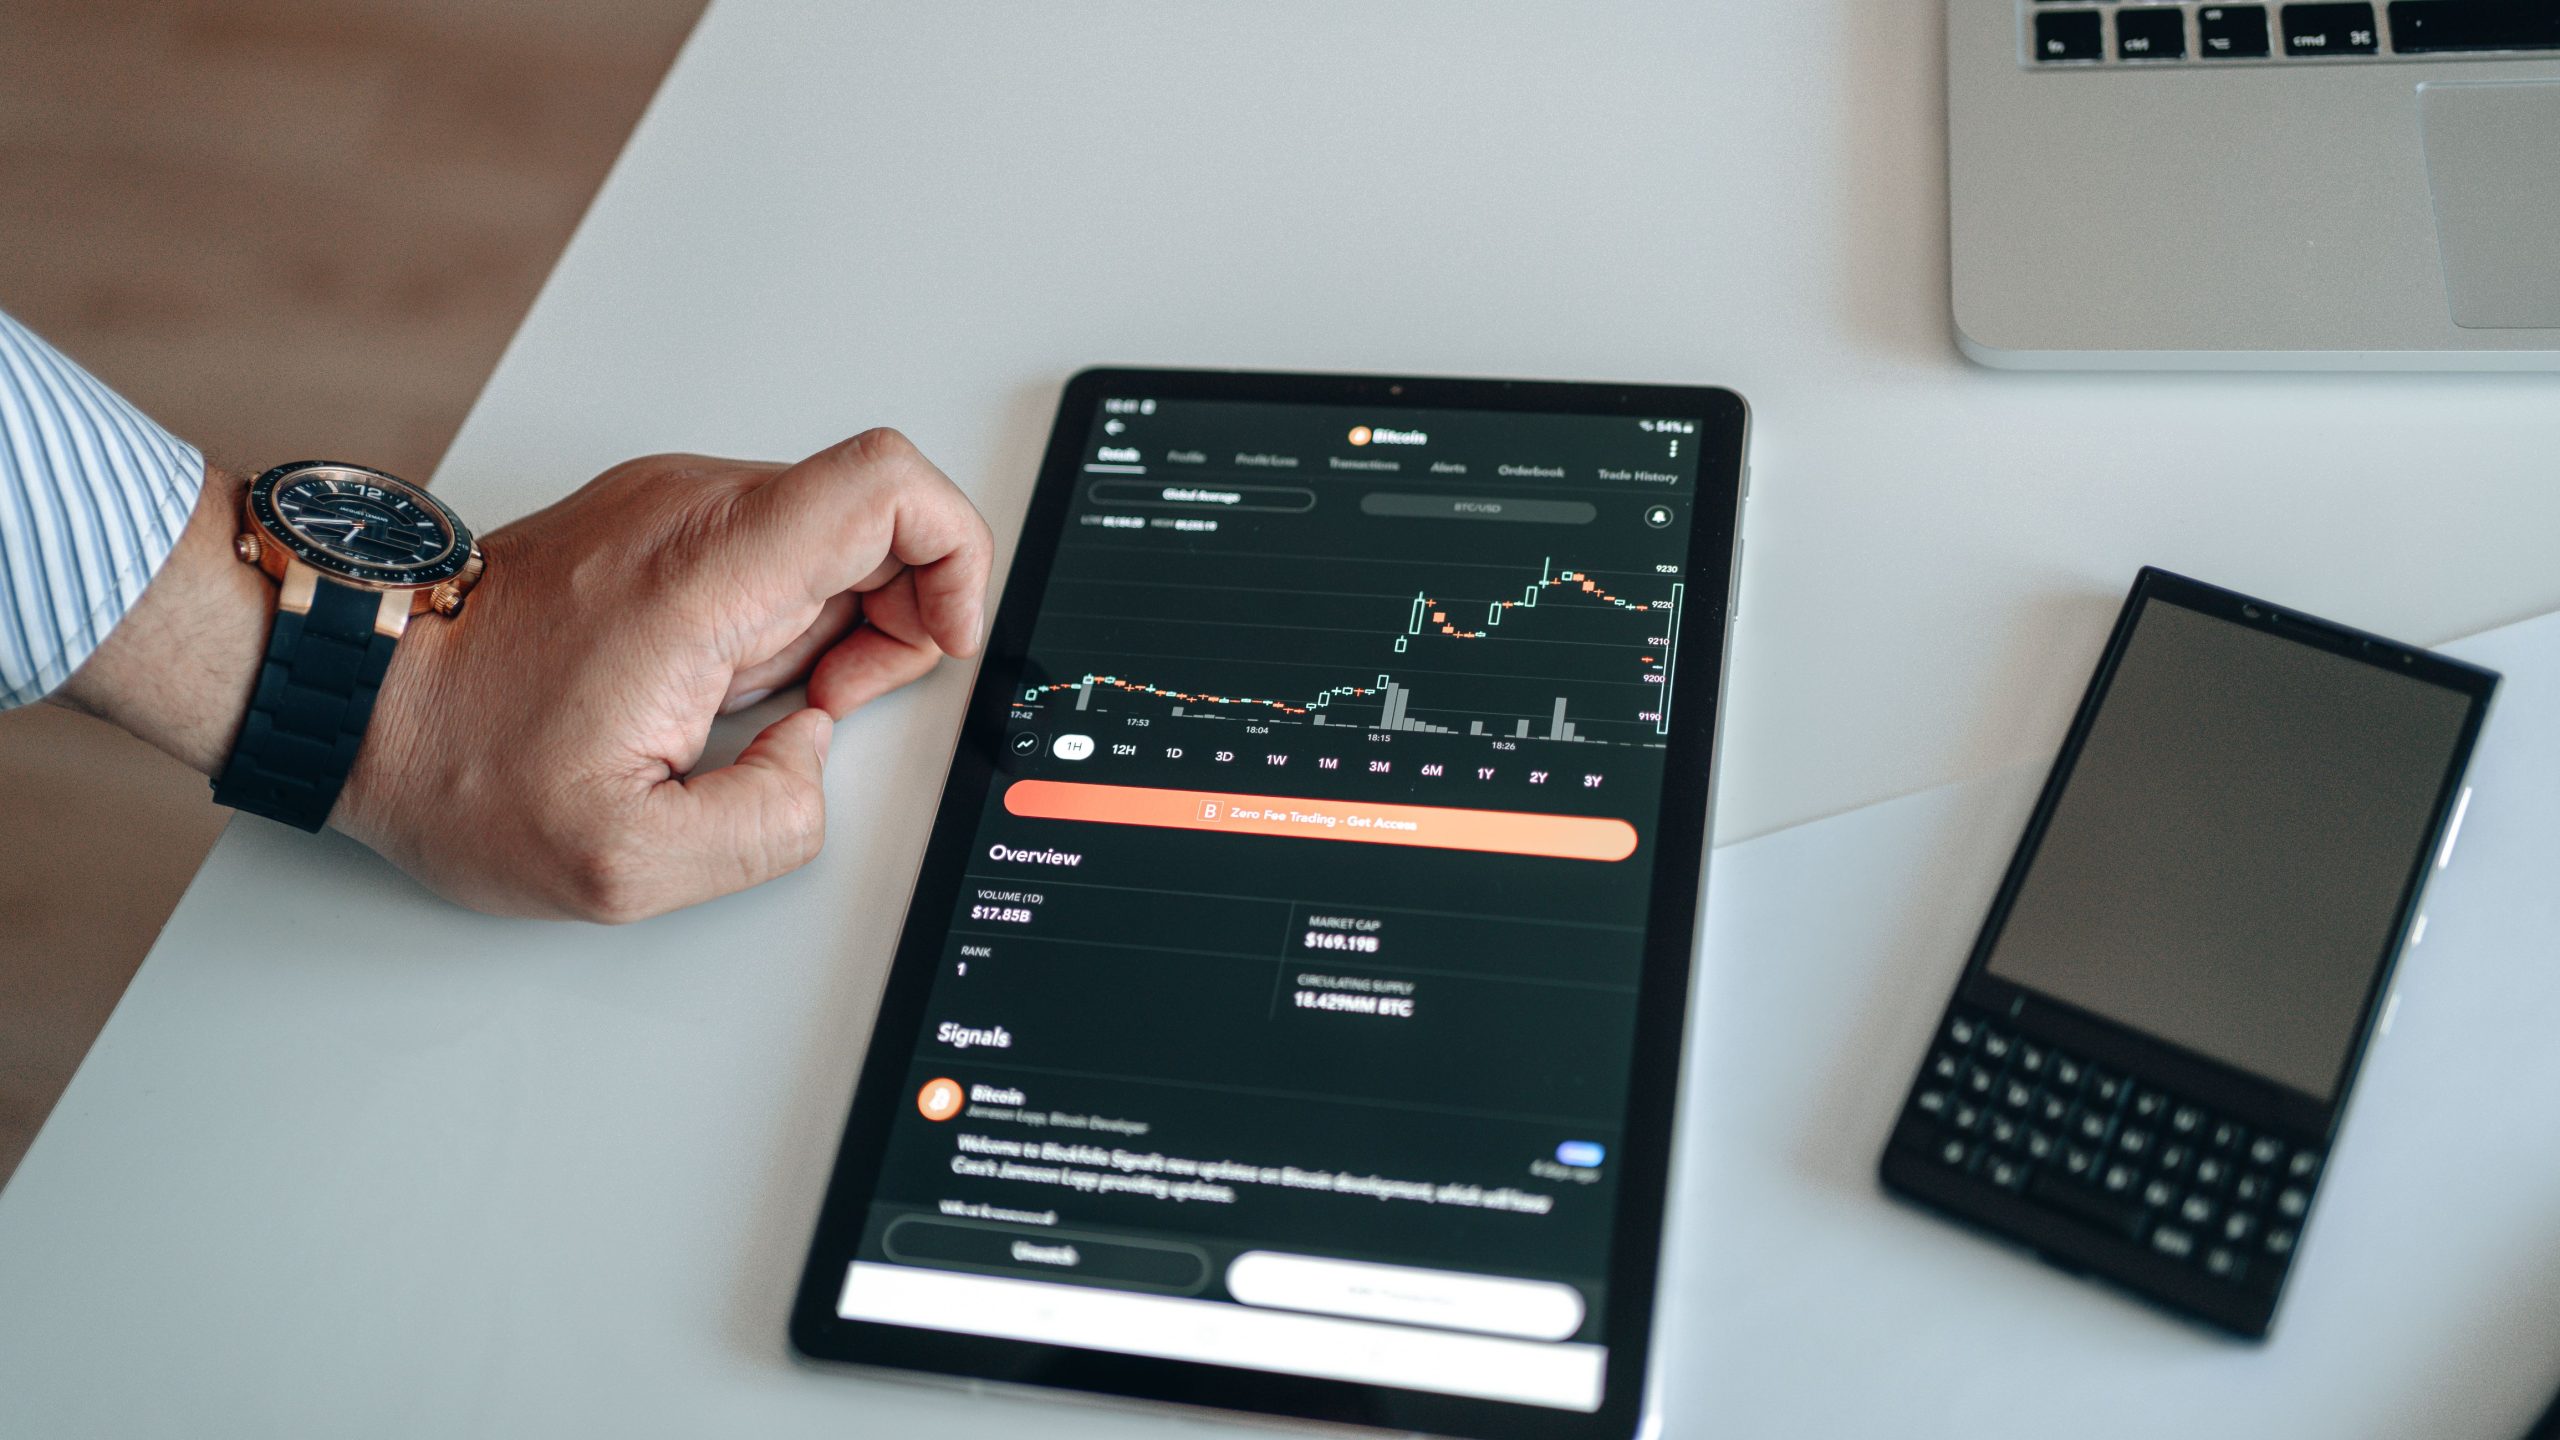
Risk dashboards are often treated as visual artifacts. Charts, heat maps, trend lines, and traffic-light indicators dominate conversations about risk reporting. Stakeholders frequently evaluate dashboards based on aesthetics, layout, or how quickly numbers can be scanned during meetings.
In practice, this view understates their true purpose. Risk dashboards are not communication tools first and foremost. They are governance tools. Their primary role is not to inform passively, but to signal where attention, challenge, and decision-making are required.
This distinction is frequently misunderstood. Teams may invest significant effort refining visuals while overlooking a more fundamental question: what behavior is this dashboard designed to trigger? A dashboard that looks clean but does not prompt discussion, escalation, or action is not neutral. It is misleading.
Dashboards sit at the intersection of data, judgment, and accountability. They translate complex risk environments into structured signals that guide senior attention. When designed and used properly, they reinforce risk culture by making uncertainty visible and forcing explicit discussion of uncomfortable trends.
This article explains what risk dashboards actually signal beyond charts, how experienced risk professionals interpret them, and why dashboards matter far more for escalation and accountability than for presentation quality.
How Risk Dashboards Signal Governance Attention
At their core, risk dashboards are filters. They compress large volumes of information into a manageable view that highlights where judgment is required. The most important outcome of a dashboard review is rarely agreement with the numbers; it is recognition that something needs to be discussed.
Experienced risk professionals do not read dashboards as statements of fact. They read them as prompts. A rising trend, a breached threshold, or an unexpected divergence signals that underlying assumptions may no longer hold or that controls may be under strain.
Dashboards therefore answer governance questions rather than analytical ones:
- Where is risk behavior changing?
- Where are controls being tested?
- Where does management need to engage?
A dashboard that attempts to explain everything removes the need for judgment and weakens governance. Effective dashboards leave room for interpretation and challenge.
This is why senior risk discussions often revolve around why a metric moved rather than what the metric is. Dashboards are designed to surface questions, not to provide conclusions. Treating dashboards as definitive answers replaces judgment with reporting, which undermines risk management effectiveness.
Dashboards Reflect Governance Design, Not Just Data Quality
What appears on a risk dashboard is never accidental. Every metric reflects a governance choice about what the institution considers important enough to monitor, escalate, and discuss.
Dashboards reveal governance priorities:
- Which risks are formally owned
- Which thresholds matter
- Which issues warrant senior attention
- Which time horizons are emphasized
Equally important is what dashboards exclude. Risks that do not appear on dashboards often lack formal escalation paths, even if they are discussed informally elsewhere. Absence from a dashboard is often a signal of governance immaturity rather than low risk.
This explains why dashboards differ materially across institutions. Differences reflect risk appetite, regulatory exposure, business model complexity, and governance philosophy — not simply data availability or analytical capability.
In mature organizations, dashboards evolve slowly. Frequent redesigns often signal uncertainty about governance priorities rather than continuous improvement. Stability in dashboards reinforces consistent expectations about escalation and accountability.
Thresholds Signal Escalation Expectations
Thresholds are one of the most misunderstood elements of risk dashboards. They are often mistaken for hard limits or failure points. In practice, thresholds are conversation triggers.
A breached threshold does not automatically indicate a problem. It signals that risk behavior has moved outside expected ranges and that explanation, context, and potential action are required.
Thresholds encode escalation logic:
- When an issue moves from monitoring to discussion
- When senior management engagement is expected
- When formal documentation or remediation may be required
Well-designed thresholds balance sensitivity and credibility. Thresholds that are too tight generate noise and desensitize stakeholders. Thresholds that are too loose create false comfort and delay action.
Dashboards without explicit thresholds shift escalation responsibility onto individuals rather than governance structures. Dashboards with clear thresholds reinforce consistent escalation behavior across time and teams.
Trends Matter More Than Point-in-Time Values
Experienced readers rarely focus on single data points. They focus on trajectories. Direction, momentum, and persistence often matter more than absolute levels.
A stable metric at a high level may be less concerning than a rapidly deteriorating metric at a lower level. Dashboards signal:
- Direction of travel
- Speed of change
- Duration of stress
Trend design reflects governance maturity. Dashboards that emphasize trends encourage forward-looking discussion rather than backward-looking explanations. They support early intervention rather than reactive remediation.
Risk dashboards often lag business dashboards deliberately. Risk functions prioritize stability, interpretability, and governance alignment over real-time precision. Excessive volatility in dashboards can obscure signal and undermine confidence.
Trends provide context that single observations cannot. They allow management to distinguish between noise and meaningful change.
Dashboards Expose Control Effectiveness
Beyond signaling risk levels, dashboards implicitly assess how well controls are functioning. Unexpected volatility, unexplained movements, or repeated breaches often indicate control weaknesses rather than changes in underlying risk appetite.
Experienced risk teams read dashboards diagnostically:
- Are controls preventing known issues?
- Are monitoring processes effective?
- Are responses timely and consistent?
Repeated threshold breaches without remediation signal governance failure, not data problems. Dashboards therefore reflect both risk outcomes and the institution’s ability to manage risk.
In this sense, dashboards are meta-controls. They assess whether other controls are working as intended. When dashboards are overly smoothed or selectively reported, they conceal control weaknesses and delay corrective action.
Risk Dashboards and Accountability Structures
Every dashboard answers an unspoken question: who is expected to act when this changes?
Effective dashboards align metrics with accountable owners, escalation paths, and decision forums. Metrics without clear ownership weaken governance by diffusing responsibility.
Dashboards therefore function as accountability maps. They make visible:
- Who monitors the metric
- Who explains deviations
- Who decides on actions
- Who owns remediation
When accountability is unclear, dashboards become passive reporting artifacts rather than active governance instruments. Over time, stakeholders disengage because signals do not lead to consequences.
Strong dashboards reinforce a culture where signals prompt ownership rather than defensiveness.
Dashboards Are Designed for Forums, Not Individuals
Risk dashboards are rarely designed for individual consumption. They are designed for governance forums: committees, senior management meetings, and board discussions.
Their purpose is to support structured dialogue:
- What changed?
- Why did it change?
- Does it matter?
- What should we do?
Dashboards that attempt to answer all four questions often fail. Effective dashboards focus on the first two and leave space for judgment on the latter two.
This is why experienced risk leaders resist dashboard overcrowding. Too many metrics dilute signal and weaken discussion quality. Dashboards should facilitate conversation, not replace it.
What Dashboards Do Not Signal
Understanding dashboards requires understanding their limits. Dashboards do not:
- Predict outcomes
- Eliminate uncertainty
- Replace judgment
- Resolve trade-offs
They are inputs to governance, not substitutes for it. Treating dashboards as definitive assessments shifts accountability away from decision-makers and toward metrics, which undermines risk culture.
Dashboards surface uncertainty; they do not remove it.
Conclusion
Risk dashboards are not about charts. They are about signals, escalation, and accountability. Their true value lies in how they shape behavior, focus attention, and support governance — not in how they look.
Effective dashboards make uncertainty visible, prompt structured discussion, and clarify responsibility. They do not simplify risk away; they surface it in a form institutions can manage.
Professionals who understand what dashboards actually signal demonstrate institutional maturity. They recognize dashboards as tools for judgment rather than answers. In risk management, that distinction matters far more than any visualization.
The material in this article is intended for informational and educational purposes only. It provides a high-level discussion of risk dashboard design and governance practices commonly observed across financial institutions. It does not constitute professional, regulatory, legal, or compliance advice. Dashboard content, thresholds, and governance usage vary by institution, jurisdiction, and business line.
Stay Ahead
Access informational and educational resources. Subscribe to the Vault Newsletter for curated materials, learning frameworks, developmental tools, and early previews of upcoming releases.