Introduction
Every trading desk within a financial institution has one fundamental objective: generate sustainable returns while operating within the organization’s approved risk appetite. Measuring whether a desk is achieving that objective, however, is far more complicated than simply reviewing daily profit and loss (P&L). A desk that generates significant profits during one quarter may have assumed excessive market risk to achieve those returns, while another desk producing more modest profits may have delivered stronger long-term performance after considering risk, capital usage, liquidity consumption, client activity, and operational efficiency.
For this reason, financial institutions have developed sophisticated performance analytics frameworks that evaluate trading businesses from multiple perspectives. Rather than relying on a single financial metric, modern trading desk performance analytics combines market data, financial reporting, risk metrics, capital utilization, client activity, and operational information into an integrated view of business performance. These analytics help traders understand the effectiveness of their strategies, enable desk heads to manage resources more efficiently, provide finance teams with profitability insights, and allow senior management to evaluate whether trading businesses are generating appropriate returns relative to the risks they assume.
Performance analytics has become increasingly important as regulatory expectations have evolved and financial markets have grown more complex. Following the Global Financial Crisis, institutions placed greater emphasis on risk-adjusted performance, capital efficiency, and sustainable profitability rather than focusing exclusively on revenue generation. Boards of directors, executive committees, regulators, and shareholders now expect trading businesses to demonstrate not only strong financial results but also disciplined risk management and efficient use of the firm’s balance sheet.
Today, performance analytics forms an essential component of trading business management. It supports strategic planning, compensation decisions, resource allocation, product development, capital optimization, and enterprise-wide governance. Whether evaluating a fixed income trading desk, an equity derivatives business, a foreign exchange franchise, or a commodities operation, performance analytics provides the quantitative foundation for understanding how effectively a trading business is operating within an increasingly competitive financial environment.
Why Trading Desk Performance Analytics Goes Beyond Profit and Loss
Profit and loss is one of the most visible metrics within any trading organization. Every trading day begins and ends with discussions surrounding how much money individual desks generated or lost, making daily P&L one of the most closely monitored figures across financial markets. While this information is undeniably important, experienced trading managers recognize that profit and loss represents only one dimension of overall performance.
The most obvious limitation is that P&L measures outcomes rather than the quality of decision-making. A trading desk may generate exceptional profits because markets moved favorably, not necessarily because portfolio construction or risk management was particularly effective. Conversely, a well-managed portfolio can experience temporary losses simply because broader market conditions moved against its positions. Evaluating performance solely on realized financial results may therefore produce misleading conclusions regarding the effectiveness of a trading strategy.
Another limitation is that P&L does not account for the amount of risk required to generate those returns. Consider two trading desks that each earn $25 million over the course of a quarter. Although their financial performance appears identical, one desk may have achieved those profits while maintaining relatively conservative market risk exposures, whereas the other may have operated near its approved risk limits throughout the period. From a governance perspective, these outcomes are very different. The first desk generated similar returns while exposing the institution to substantially less potential loss.
Capital utilization provides another important consideration. Trading businesses consume significant financial resources, including regulatory capital, funding, liquidity, collateral, technology infrastructure, and operational support. A desk generating high profits but requiring disproportionately large capital allocations may ultimately contribute less economic value than a smaller business producing more efficient returns. Performance analytics therefore evaluates profitability alongside measures such as Return on Risk-Weighted Assets (RORWA), Return on Equity (ROE), Return on Capital (ROC), or other internal capital efficiency metrics.
Client activity also influences performance interpretation. Some trading desks primarily facilitate customer transactions rather than taking significant proprietary positions. During periods of reduced market volatility, these businesses may experience lower revenues despite maintaining excellent client relationships and executing transactions efficiently. Evaluating such desks solely on P&L could underestimate their strategic importance to the broader franchise.
Operational factors further complicate the picture. Technology outages, pricing errors, settlement issues, regulatory developments, or changing market liquidity can all influence financial results independently of trading skill. Effective performance analytics therefore considers operational context alongside financial outcomes to distinguish temporary external factors from structural business trends.
Ultimately, P&L explains what happened financially during a reporting period, but it rarely explains why those results occurred or whether they are sustainable over time. Performance analytics fills this gap by incorporating additional financial, operational, client, and risk information that allows management to evaluate trading businesses more comprehensively. Rather than replacing profit and loss reporting, performance analytics provides the broader context necessary for informed strategic decision-making.
Why Trading Desk Performance Analytics Goes Beyond Profit and Loss
Trading desk performance analytics refers to the systematic process of measuring, analyzing, and interpreting the financial, operational, and risk characteristics of a trading business. Rather than focusing on a single indicator, performance analytics combines numerous quantitative and qualitative measures to provide a balanced assessment of how effectively a trading desk is achieving its objectives.
At its core, performance analytics seeks to answer several fundamental questions. Is the trading desk generating sustainable profitability? Are returns appropriate relative to the risks being assumed? Is capital being used efficiently? Are client relationships contributing to long-term business growth? Is operational performance supporting consistent execution? Are current strategies aligned with the institution’s broader business objectives?
Answering these questions requires integrating information from multiple sources across the organization. Front-office trading systems contribute transaction-level data, positions, pricing information, and realized profit and loss. Market risk systems provide Value at Risk, sensitivities, stress testing, and concentration measures. Finance organizations supply revenue reporting, balance sheet utilization, funding costs, transfer pricing adjustments, and capital consumption metrics. Operations teams contribute settlement statistics, trade processing efficiency, and operational loss information, while client relationship systems provide activity levels, transaction volumes, and revenue by customer segment.
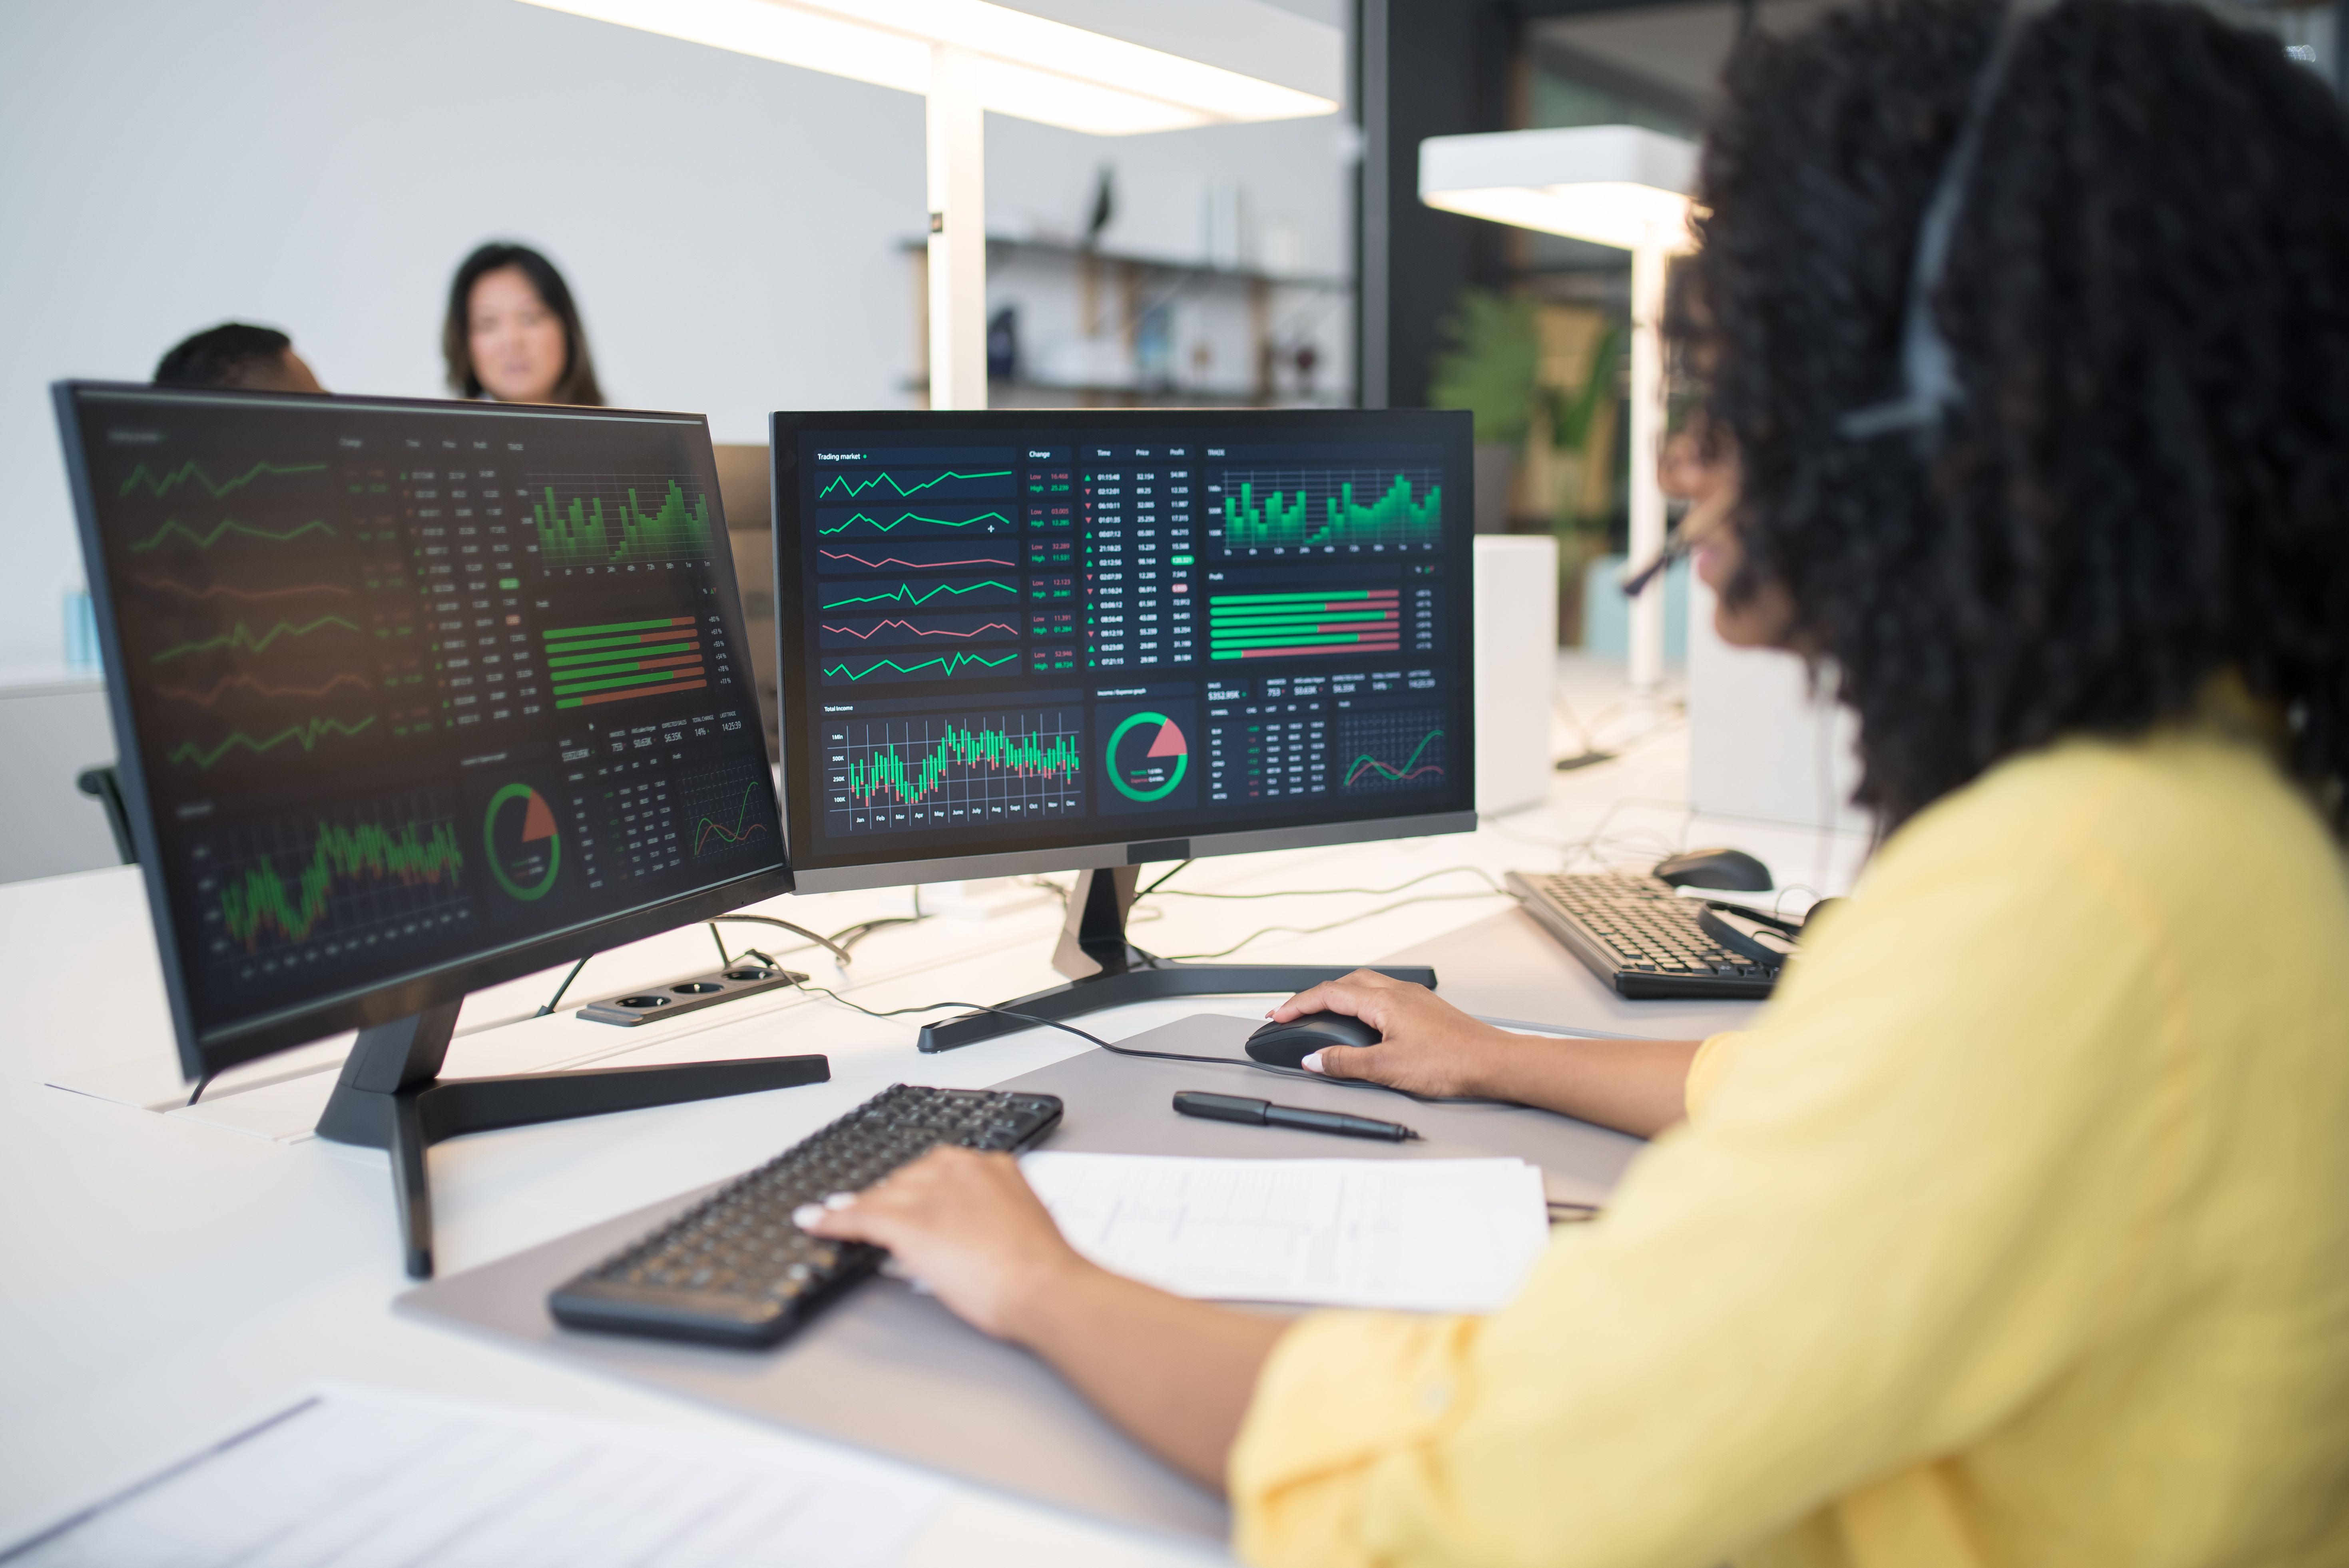
These diverse data sources are transformed into performance dashboards that allow users to evaluate trading businesses across numerous dimensions simultaneously. Rather than reviewing independent reports prepared by separate departments, management receives an integrated view of financial performance, risk, capital efficiency, client activity, and operational effectiveness.
Performance analytics also supports different levels of decision-making throughout the organization. Individual traders monitor position performance, execution quality, and portfolio characteristics throughout the trading day. Desk heads evaluate resource allocation, staffing, and strategy execution across multiple trading teams. Business managers analyze profitability trends, budgeting, expense management, and capital utilization. Executive leadership reviews enterprise-wide performance when making strategic decisions regarding investment priorities, business expansion, or organizational restructuring.
Importantly, performance analytics is not designed solely to evaluate historical performance. Modern analytics increasingly incorporates forward-looking indicators that help management anticipate future developments. Changes in client activity, declining market liquidity, increasing capital requirements, evolving regulatory expectations, or shifts in market volatility may all influence future performance before they become visible through financial results alone.
By integrating financial, operational, client, and risk information into a single analytical framework, trading desk performance analytics provides institutions with a more complete understanding of business performance than traditional financial reporting could achieve independently.
The Different Dimensions of Trading Desk Performance
One of the defining characteristics of modern trading desk performance analytics is that it evaluates success across multiple dimensions rather than relying on any single measurement. Financial institutions recognize that high-performing trading businesses balance profitability, risk management, operational excellence, client service, and capital efficiency simultaneously. Effective analytics therefore organizes performance into several complementary categories that together provide a comprehensive assessment of business performance.
The first dimension is financial performance, which remains the foundation of most trading analytics. Revenue generation, net trading income, realized and unrealized profit and loss, fee income, financing costs, and expense allocations all contribute to understanding whether a trading desk is producing acceptable financial results. Trend analysis allows management to compare current performance with previous months, quarters, or years while identifying seasonal patterns and structural changes affecting profitability.
The second dimension involves risk-adjusted performance. Financial returns have little meaning without understanding the level of market risk required to generate them. Institutions therefore compare profits with metrics such as Value at Risk, stress testing results, sensitivities, concentration measures, and limit utilization. These comparisons help determine whether a desk is generating attractive returns while remaining consistent with the firm’s risk appetite. Businesses consistently producing strong risk-adjusted returns often demonstrate greater long-term sustainability than those relying on elevated market exposures.
A third dimension focuses on capital and balance sheet efficiency. Trading businesses consume scarce financial resources, including regulatory capital, liquidity, funding, and collateral. Performance analytics evaluates whether these resources are being used productively by measuring returns relative to capital consumption. Management may compare businesses using internal performance metrics that consider balance sheet utilization alongside traditional profitability measures, supporting more informed capital allocation decisions across the organization.
Client activity represents another increasingly important performance dimension. Many modern trading businesses operate primarily as client service organizations rather than proprietary investment operations. Transaction volumes, client profitability, market share, execution quality, customer retention, and revenue diversification all contribute to understanding whether the desk is strengthening its franchise while generating sustainable income. Strong client metrics often indicate future revenue opportunities even during periods of temporarily weaker market conditions.
Operational effectiveness completes the picture. Efficient trade processing, low operational error rates, technology availability, regulatory compliance, and timely settlement all influence long-term business performance. Operational weaknesses may not immediately affect trading revenue but can create financial losses, regulatory issues, reputational damage, or increased operating costs if left unaddressed. Performance analytics therefore incorporates operational metrics alongside financial measures to provide a more balanced assessment of overall business health.
By evaluating these multiple dimensions together, financial institutions gain a much deeper understanding of trading performance than any individual metric could provide. This multidimensional perspective supports better decision-making, stronger governance, and more sustainable long-term business management.
How Traders Use Performance Analytics
For traders, performance analytics is much more than a periodic management report—it is an operational tool that supports hundreds of decisions throughout the trading day. Every trade executed, every position added or reduced, and every market movement influences the overall performance of the desk. While profit and loss remains one of the most closely monitored indicators, successful traders understand that sustained performance depends on balancing revenue generation with disciplined risk management, capital efficiency, and effective portfolio construction.
Performance analytics allows traders to monitor the health of their books from several perspectives simultaneously. At the beginning of each trading day, many traders review dashboard summaries that include the previous day’s profit and loss, overnight market movements, current positions, risk sensitivities, Value at Risk (VaR), stress testing results, concentration exposures, financing costs, and available risk limits. Rather than examining these metrics independently, traders assess how they interact to understand the current state of the portfolio before markets become active.
As trading activity progresses throughout the day, performance analytics helps evaluate the impact of new transactions. Every trade changes not only expected profitability but also the portfolio’s overall risk profile, balance sheet utilization, liquidity consumption, and diversification. Before executing larger transactions, traders frequently review analytics dashboards to determine whether the proposed trade remains consistent with both market expectations and internal risk objectives.
Performance analytics also supports portfolio optimization. Financial markets rarely remain static, and positions that were appropriately balanced several weeks earlier may become concentrated as market prices change. A rally in government bonds, for example, may significantly increase duration exposure without the trader executing additional transactions. Similarly, a surge in technology stocks may cause equity portfolios to become increasingly concentrated within one industry. Performance dashboards allow traders to identify these changes early and rebalance exposures where appropriate.
Another important application involves evaluating trading strategies over longer periods. Individual trading days often contain considerable market noise, making it difficult to determine whether a strategy is consistently adding value. Performance analytics aggregates information across weeks, months, and quarters, enabling traders to compare historical performance under different market conditions. This longer-term perspective helps distinguish temporary market fluctuations from structural improvements or weaknesses in trading approaches.
Execution quality represents another area where analytics provides meaningful insight. Many institutions measure bid-offer capture, execution costs, slippage, transaction timing, and market impact to understand whether trades are being executed efficiently. Strong trading performance depends not only on selecting attractive investment opportunities but also on entering and exiting positions at competitive prices while minimizing unnecessary costs.
Increasingly, traders also use predictive analytics to anticipate how changes in market conditions could affect future performance. Rather than reacting solely to realized results, dashboards incorporate forward-looking indicators such as changes in market volatility, liquidity conditions, client transaction flows, and macroeconomic events that may influence portfolio performance during upcoming trading sessions.
Ultimately, performance analytics enables traders to move beyond evaluating individual transactions toward managing the overall health of the trading portfolio. By integrating financial performance with market risk, capital utilization, liquidity, and execution quality, traders gain a more comprehensive understanding of how daily decisions contribute to long-term success.
How Desk Heads and Business Managers Evaluate Performance
While individual traders focus primarily on managing portfolios and executing market strategies, desk heads and business managers evaluate performance from a broader organizational perspective. Their responsibilities extend beyond the profitability of individual positions to include resource allocation, strategic planning, financial management, staffing decisions, client franchise development, operational efficiency, and long-term business growth. Performance analytics provides the information necessary to oversee these responsibilities while balancing commercial objectives with the institution’s overall risk appetite.
Desk heads typically begin by reviewing consolidated performance across all traders within their business. Rather than concentrating on isolated trading results, they evaluate how individual portfolios contribute to overall desk profitability and whether performance is being generated consistently across the team. Analytics help identify which products, client segments, or market strategies are driving revenue while also highlighting areas where profitability may be weakening.
Trend analysis plays a particularly important role at this level. Daily fluctuations in financial markets can produce significant short-term volatility that may not accurately reflect underlying business performance. Business managers therefore place greater emphasis on monthly, quarterly, and annual trends when assessing the health of the trading franchise. These longer-term views provide greater insight into revenue stability, market share, expense management, client growth, and strategic positioning than isolated daily results.
Performance analytics also supports financial planning and budgeting activities. Business managers compare actual revenues and expenses against budget forecasts, monitor compensation costs, technology investments, infrastructure spending, and operational expenditures, and evaluate whether the business is delivering expected financial returns. Significant variances prompt discussions regarding staffing levels, resource allocation, investment priorities, or changes in business strategy.
Capital efficiency has become another major area of focus. Following post-financial crisis regulatory reforms, trading businesses are expected not only to generate strong revenues but also to use capital efficiently. Business managers therefore monitor regulatory capital consumption, balance sheet utilization, liquidity usage, funding costs, and collateral requirements alongside traditional profitability measures. Performance dashboards frequently compare businesses using internal return metrics that incorporate both revenue generation and capital consumption, allowing management to allocate resources more effectively across competing business lines.
Client analytics also contributes significantly to management decision-making. Dashboards often summarize revenue by client segment, product line, geographic region, transaction volume, wallet share, and customer profitability. These insights help management identify opportunities for business expansion while strengthening relationships with strategically important clients. A desk producing moderate trading revenue but demonstrating strong client growth may represent an attractive long-term investment opportunity despite temporarily lower financial performance.
Operational performance receives similar attention. Desk heads monitor trade processing efficiency, settlement accuracy, regulatory reporting quality, technology availability, operational incidents, and staffing capacity to ensure business infrastructure continues supporting trading activity effectively. Persistent operational weaknesses may eventually affect financial performance if not addressed proactively.
By integrating financial, operational, client, and strategic information into a single analytical framework, performance analytics enables desk heads and business managers to make informed decisions that support both immediate business objectives and long-term franchise development.
How Independent Market Risk and Finance Use Performance Analytics
Although traders and business managers use performance analytics to improve commercial performance, independent control functions interpret the same information through different objectives. Market Risk and Finance are less concerned with maximizing trading revenues and more focused on ensuring that financial performance is sustainable, accurately measured, appropriately controlled, and consistent with the institution’s governance framework. Performance analytics therefore serves as an important bridge between front-office business management and independent oversight.
For Market Risk, one of the primary questions is whether financial returns appropriately reflect the level of market risk being assumed. Strong profits generated while operating comfortably within approved risk appetite generally indicate disciplined portfolio management. Conversely, unusually high returns achieved through elevated risk concentrations, aggressive limit utilization, or significant exposure to stressed market conditions may require additional review. Performance analytics enables market risk professionals to evaluate these relationships by comparing profitability with Value at Risk, stress testing, sensitivities, concentration metrics, and historical exposure trends.
Market Risk also examines the consistency of performance over time. Highly volatile earnings may suggest excessive dependence on specific market events or concentrated trading strategies, while stable risk-adjusted returns often indicate stronger portfolio diversification and more disciplined risk management practices. Rather than evaluating one day’s results in isolation, market risk professionals review longer-term trends to understand whether the desk’s performance profile remains aligned with the institution’s overall risk appetite.
Independent review also extends to emerging portfolio risks. Performance analytics frequently reveals changes in trading behavior before they become apparent through traditional governance reports. A gradual increase in risk utilization, declining diversification, growing exposures to particular market sectors, or deteriorating liquidity conditions may all warrant additional dialogue between market risk and trading management. These discussions support proactive risk management rather than reactive intervention after market conditions have already deteriorated.
Finance views performance analytics through another complementary perspective. While traders naturally emphasize market opportunities, Finance focuses on accurately measuring business profitability and understanding the economic drivers influencing financial results. Analysts review revenue composition, funding costs, transfer pricing adjustments, balance sheet utilization, expense allocations, and capital consumption to ensure reported performance reflects the true economics of the business rather than isolated accounting outcomes.
Finance teams also support strategic resource allocation across the institution. Senior management must continually decide where to invest capital, technology resources, and personnel. Performance analytics enables Finance to compare businesses using consistent financial and economic measures, helping identify which trading franchises are producing the strongest long-term returns after considering capital requirements, operating costs, funding expenses, and risk-adjusted profitability.
The collaboration between Market Risk, Finance, and the front office represents one of the defining characteristics of modern trading governance. Although each function evaluates performance through its own responsibilities, all rely upon the same underlying analytical framework to support informed decision-making. Shared performance metrics improve transparency, facilitate constructive challenge, and ensure discussions focus on objective data rather than isolated financial outcomes.
By providing a common view of profitability, risk, capital efficiency, and operational performance, trading desk performance analytics strengthens governance across the institution while enabling both business leaders and independent control functions to make more informed strategic decisions.
Dashboard Design and Key Performance Metrics
A trading desk generates an enormous amount of information every day. Thousands of trades are executed, positions fluctuate continuously as markets move, profit and loss changes throughout the trading session, client activity varies across products, and market risk exposures evolve with every transaction. While all of this information is valuable, senior management cannot realistically review hundreds of individual reports to understand whether a trading business is performing effectively. Trading desk performance dashboards solve this problem by transforming complex operational data into clear, actionable management information.
The design of a performance dashboard begins with identifying the audience. Individual traders require detailed operational information that supports day-to-day portfolio management, while desk heads need broader insights into team performance, resource utilization, and business strategy. Executive committees and senior leadership require even higher-level summaries that focus on the overall health of the trading business rather than individual transactions. Effective dashboards therefore present information in layers, allowing users to begin with executive summaries before drilling down into increasingly detailed analytics when necessary.
Financial performance typically occupies the most prominent position within the dashboard. Daily, month-to-date, quarter-to-date, and year-to-date profit and loss provide immediate visibility into revenue generation while trend charts illustrate whether performance is improving, deteriorating, or remaining relatively stable over time. Many institutions supplement raw P&L with comparisons against budget, forecast, and prior-year performance to provide greater business context.
Risk-adjusted performance metrics are equally important. Rather than evaluating profits independently, dashboards compare financial results with measures such as Value at Risk (VaR), stress testing outcomes, sensitivity exposures, concentration metrics, and limit utilization. These comparisons help management determine whether trading desks are generating returns efficiently while remaining within approved market risk tolerances.
Capital and balance sheet utilization have also become central components of executive reporting. Dashboards frequently display capital consumption, funding usage, collateral requirements, liquidity utilization, and internal return metrics that compare profitability with the financial resources required to support trading activity. These measures allow senior leadership to evaluate whether capital is being allocated to businesses generating the strongest long-term economic returns.
Client analytics provide another valuable perspective. Dashboards often summarize transaction volumes, client revenues, new client acquisition, market share, product penetration, and revenue diversification across customer segments. Because many modern trading businesses operate primarily as client facilitation franchises, these indicators help management assess the long-term strength of customer relationships beyond short-term market performance.
Operational metrics complete the dashboard by measuring settlement efficiency, technology availability, operational incidents, trade processing accuracy, regulatory reporting quality, and outstanding control issues. Although these indicators may not directly influence daily profitability, they provide early warning signals regarding operational weaknesses that could eventually affect financial performance or regulatory compliance.
Modern dashboards increasingly include interactive functionality that allows executives to explore underlying drivers rather than viewing only static reports. Users can filter information by trading desk, product, legal entity, region, client segment, or reporting period while trend analysis illustrates how performance has evolved over time. This combination of summary reporting and detailed analytical capability enables decision-makers to identify emerging issues quickly while maintaining access to the supporting information needed for informed business discussions.
Ultimately, effective dashboard design allows complex trading businesses to be monitored through a relatively small number of carefully selected performance indicators. By presenting financial, risk, client, capital, and operational information within a unified reporting framework, performance dashboards support faster decision-making and stronger enterprise governance.
Challenges and Limitations of Performance Analytics
Despite their importance, trading desk performance analytics should never be viewed as definitive measures of business success. Every analytical framework has limitations, and effective decision-making depends upon understanding what performance metrics reveal, what they omit, and how different measures should be interpreted collectively. Financial institutions therefore treat performance analytics as one component of a broader management process rather than a substitute for professional judgment.
One of the most significant challenges is separating performance generated through skill from performance driven by favorable market conditions. Financial markets periodically experience strong directional trends that benefit certain trading strategies regardless of execution quality. During these periods, even relatively simple portfolios may generate substantial profits because broader market movements support existing positions. Conversely, highly skilled traders may experience disappointing financial results during unusually volatile or illiquid market conditions despite executing disciplined investment strategies. Performance analytics therefore attempts to distinguish structural business performance from temporary market effects, although doing so is rarely straightforward.
Time horizon presents another important consideration. Daily performance can fluctuate dramatically because of market volatility, client transaction timing, valuation adjustments, or macroeconomic events. Evaluating a trading business solely on short-term results may produce conclusions that differ significantly from those reached after reviewing several quarters or multiple years of performance. Most institutions therefore analyze performance across numerous reporting periods to identify sustainable trends rather than reacting excessively to isolated daily outcomes.
Comparability also creates challenges. Different trading businesses operate under very different market conditions, liquidity profiles, client demands, regulatory requirements, and capital structures. Comparing a government bond trading desk with an equity derivatives business using identical performance measures may fail to reflect the unique characteristics of each market. Institutions often supplement standardized enterprise metrics with business-specific indicators that better capture the drivers of performance within individual asset classes.
Data quality remains another critical consideration. Performance analytics integrates information from numerous systems, including trading platforms, finance databases, market risk engines, operations systems, and client reporting tools. Inconsistent data definitions, delayed reporting, pricing differences, or incomplete position information can materially affect reported performance if appropriate data governance controls are not maintained.
Behavioral incentives must also be managed carefully. Employees naturally respond to the metrics used to evaluate performance. If dashboards emphasize revenue generation without adequately considering market risk or capital utilization, trading behavior may gradually shift toward higher-risk strategies. Conversely, excessive emphasis on conservative risk management may discourage appropriate risk-taking and reduce long-term profitability. Institutions therefore design balanced scorecards that encourage sustainable business performance rather than optimizing one metric at the expense of others.
Another limitation involves external factors beyond the control of the trading desk. Regulatory changes, geopolitical developments, central bank policy decisions, technology disruptions, or declining market liquidity can all influence financial results independently of business performance. Analytics identify these outcomes but cannot always distinguish controllable factors from broader market events without additional qualitative assessment.
These challenges reinforce an important principle: performance analytics provides evidence to support management decisions, but it does not replace experienced leadership, sound judgment, or constructive dialogue between trading businesses and independent control functions. The most effective organizations combine robust analytics with thoughtful interpretation to develop a balanced understanding of business performance.
Technology Behind Modern Trading Analytics
The ability to measure trading desk performance with precision depends upon sophisticated technology infrastructure capable of processing enormous volumes of financial data. Modern trading organizations operate across global markets twenty-four hours a day, executing transactions involving millions of securities, derivatives, currencies, commodities, and structured products. Performance analytics transforms this constant flow of information into meaningful insights that support decision-making at every level of the organization.
The process begins with trade capture systems. Every executed transaction is automatically recorded within front-office platforms, capturing information such as product type, execution price, quantity, counterparty, trader, trading desk, and booking location. These systems provide the foundational transaction data upon which all subsequent performance analysis depends.
Trade information is then integrated with market data including prices, yield curves, foreign exchange rates, volatility surfaces, commodity prices, and benchmark indices. As market conditions change throughout the trading day, portfolios are continuously revalued, allowing institutions to calculate unrealized profit and loss, market risk exposures, financing costs, and other performance indicators using current market conditions.
Risk engines operate alongside these valuation systems to calculate Value at Risk, stress testing results, sensitivities, concentration exposures, and other market risk measures. Finance platforms contribute revenue recognition, expense allocations, transfer pricing adjustments, regulatory capital calculations, funding costs, and balance sheet utilization metrics. Operations systems add settlement performance, processing efficiency, technology availability, and operational control information. Together, these systems create an integrated analytical environment spanning multiple business functions.
Business intelligence platforms aggregate this information into dashboards tailored for different users. Traders typically receive highly detailed portfolio-level analytics updated throughout the trading day, while desk heads review consolidated business performance. Executive dashboards emphasize key strategic indicators, allowing senior management to evaluate overall business performance without becoming overwhelmed by operational detail.
Cloud computing has significantly expanded analytical capabilities in recent years. Institutions can process larger datasets, perform more sophisticated scenario analysis, and deliver interactive dashboards to users across global trading locations with far greater speed than traditional infrastructure allowed. Enhanced computing power also supports near real-time reporting, enabling decision-makers to respond more quickly as market conditions evolve.
Artificial intelligence is becoming increasingly integrated into performance analytics as well. Machine learning models can identify unusual performance patterns, detect emerging changes in client behavior, forecast transaction volumes, prioritize performance anomalies requiring investigation, and assist business managers in identifying trends that may not be immediately visible through traditional reporting techniques. Natural language processing is also beginning to supplement quantitative analytics by incorporating earnings announcements, economic news, regulatory developments, and other qualitative information into broader business performance assessments.
Despite rapid technological innovation, successful performance analytics continues to depend upon strong governance. Data quality, model validation, consistent business definitions, standardized reporting methodologies, and clearly defined ownership remain essential to ensuring performance metrics are both accurate and trusted throughout the organization. Technology accelerates analysis, but reliable governance ensures that analysis supports sound business decisions.
Why Performance Analytics Has Become a Strategic Management Tool
Trading desk performance analytics has evolved considerably over the past several decades. What once consisted primarily of financial reporting has developed into a comprehensive management framework supporting strategic planning, resource allocation, governance, and long-term business development. Today, performance analytics is viewed not merely as a reporting function but as one of the most important decision-support capabilities within modern investment banks.
One reason for this evolution is the growing complexity of financial markets. Trading businesses now operate across numerous products, jurisdictions, regulatory frameworks, and client segments while managing increasingly sophisticated market risks. Traditional financial statements alone cannot adequately explain how these businesses generate returns or where future opportunities and vulnerabilities may exist. Performance analytics bridges this gap by integrating financial, operational, client, and risk information into a unified view of business performance.
Another factor is the increasing emphasis on capital efficiency. Regulatory reforms introduced after the Global Financial Crisis significantly increased capital and liquidity requirements for trading activities. Institutions must therefore allocate scarce financial resources carefully, directing capital toward businesses capable of generating sustainable returns while operating within acceptable risk parameters. Performance analytics provides the objective information required to support these allocation decisions.
Performance analytics also strengthens communication throughout the organization. Traders, business managers, finance, market risk, operations, technology, executive leadership, and regulators all rely upon many of the same performance metrics when evaluating trading businesses. Standardized dashboards establish a common language that improves transparency, supports constructive challenge, and facilitates more effective governance discussions.
Forward-looking analysis has become another defining characteristic of modern performance management. Rather than explaining only what has already occurred, advanced analytics help management anticipate future developments by monitoring client activity, market volatility, liquidity conditions, capital utilization, revenue trends, and operational performance. These leading indicators allow institutions to respond proactively rather than waiting for financial results to deteriorate before taking action.
Performance analytics also plays a significant role in strategic planning. Long-term investment decisions involving new products, technology modernization, staffing, geographic expansion, or business restructuring depend upon understanding which businesses consistently create value. By comparing profitability, capital efficiency, client growth, and operational performance across multiple trading franchises, senior management can make more informed decisions regarding future investment priorities.
Perhaps most importantly, performance analytics reinforces accountability throughout the organization. Clear performance measures establish transparent expectations while enabling objective evaluation of business outcomes. This promotes a culture in which financial performance, prudent risk management, operational excellence, and client service are viewed as complementary objectives rather than competing priorities.
As financial institutions continue to invest in digital transformation, artificial intelligence, and advanced data analytics, trading desk performance analytics will remain a cornerstone of business management, supporting informed decision-making from individual trading desks to board-level governance.
Conclusion
Trading desk performance analytics provides financial institutions with a comprehensive framework for evaluating how effectively trading businesses generate sustainable returns while operating within approved risk appetite. Although daily profit and loss remains an important measure of financial success, modern performance management extends far beyond revenue generation by incorporating market risk, capital efficiency, client activity, operational performance, and long-term business strategy into an integrated analytical framework.
Across the organization, traders use performance analytics to optimize portfolios and monitor execution quality, desk heads evaluate business performance and resource allocation, finance measures profitability and capital utilization, while independent market risk assesses whether returns remain consistent with the institution’s governance framework. Executive leadership relies on consolidated dashboards to support strategic planning, investment decisions, and enterprise-wide oversight.
As financial markets become increasingly interconnected and data-driven, performance analytics has evolved into far more than a reporting function. It has become a strategic management capability that helps institutions balance profitability with prudent risk management, improve transparency across business functions, and make more informed decisions that support sustainable long-term growth.
This article is provided for informational and educational purposes only. It offers a high-level overview of trading desk performance analytics and its role within financial institutions. It should not be interpreted as investment, trading, financial, legal, regulatory, accounting, tax, or professional advice. Performance measurement methodologies, reporting frameworks, key performance indicators, governance practices, and regulatory expectations vary across financial institutions and jurisdictions and may evolve over time.
Stay Ahead
Access informational and educational resources. Subscribe to the Vault Newsletter for curated materials, learning frameworks, developmental tools, and early previews of upcoming releases.